

Agri-footprint 8: will your results change?
Every shift explained, down to the dataset
Moving to Agri-footprint 8? Your first question is simple: will my footprint results change? Some datasets barely move, while others shift noticeably, up or down. Here’s where the changes come from, how big they are, and what they mean for your calculations.
This article summarizes the main insights from our comparison report (Agri-footprint 8 documentation, Part 3), which will be published soon.
Impact changes in Agri-footprint 8
The biggest changes between Agri-footprint 7 and 8 come from the following three methodological updates:
-
NPK fertilizer modelling: crop- and country-specific fertilizer rates from high-resolution spatial data (NPKGRIDS) replace generic averages, so fertilizer-related emissions better reflect real farming practice.
-
Peat emission modelling: based on the latest National Inventory Reports (and Cao, L., et al. 2026, for countries that do not report to NIR), so emissions from crops grown on drained peat soils are captured more completely.
-
Land occupation: crop- and country-specific GIS data replaces the former statistical country-specific land occupation approach.
Shifts across the database
To quantify the impact of these changes on the database as a whole, we calculated all impacts before and after each of the updates. The result gives a clear overview of the changes in impacts.
Most datasets sit close to 0%, while a smaller group shifts by more than 50% in either direction. Including land use change and peat, the median change is around 9%; excluding them, it is around 1%. When we look at the global warming excluding the land use change and peat oxidation the impacts are less variable.
When we look at these changes in isolation, we can trace how specific changes affected the impacts over specific groups.
For the land occupation and NPK updates, the median change is close to zero (0–1%). Individual crops may shift up or down, but there is no systematic shift towards higher or lower emissions across the database.
With the peat update, Agri-footprint 8 captures emissions from drained peat soils more completely, based on the latest National Inventory Reports. As a result, impacts are higher for crops grown in regions with peat soils.
Count: 75 products
Figure 1 - Change in climate impact per dataset, Agri-footprint 7 vs 8. distribution of the change. Use the toggle above to see the switch between impact categories.
Every change traceable
Down to the dataset
For every dataset, we tracked the effect of each individual update since Agri-footprint 7, so we know exactly how emissions changed per inventory and what caused the shift. Full details will be available in the Agri-footprint 8 documentation, Part 3.
To show how this works in practice, the examples below highlight the updates that drove the change for individual datasets.
Already using Agri-footprint 7? On request, we can provide change diagrams for the datasets you use. See how at the bottom of this page.
Example: rice from Thailand
In Agri-footprint 8, we updated the rice methane modelling for PEF compliancy. Under flooded conditions, organic matter decomposes anaerobically, producing methane that is released into the atmosphere throughout the cultivation cycle. By accounting for these organic residues along with ecosystem-specific water regimes, regional cultivation lengths, and farm-level inputs like straw and manure, Agri-footprint 8 provides a more accurate reflection of paddy emissions.
As illustrated in figure 2, in Thai paddy rice cultivation, these methodological updates contribute to an overall increase in global warming potential compared to version 7.
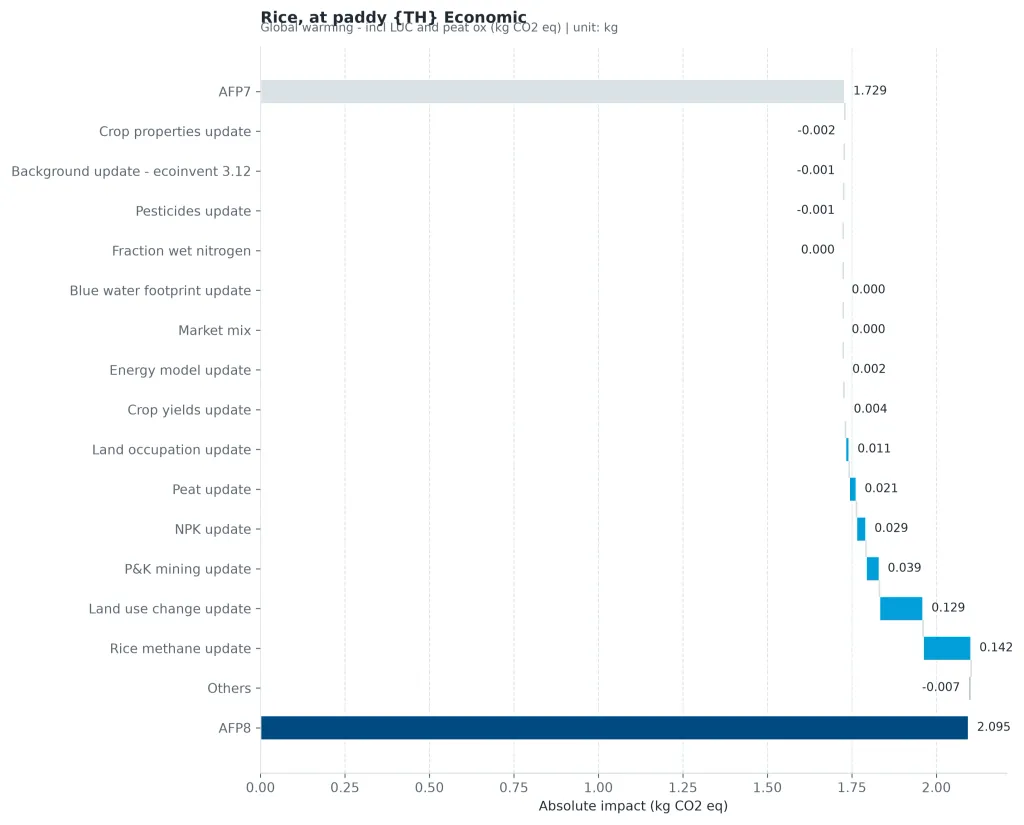
Figure 2 – What drives the change? Contribution of each update to the climate impact of rice from Thailand (incl. LUC and peat, kg CO₂-eq/kg), from Agri-footprint 7 (top bar) to Agri-footprint 8 (bottom bar).
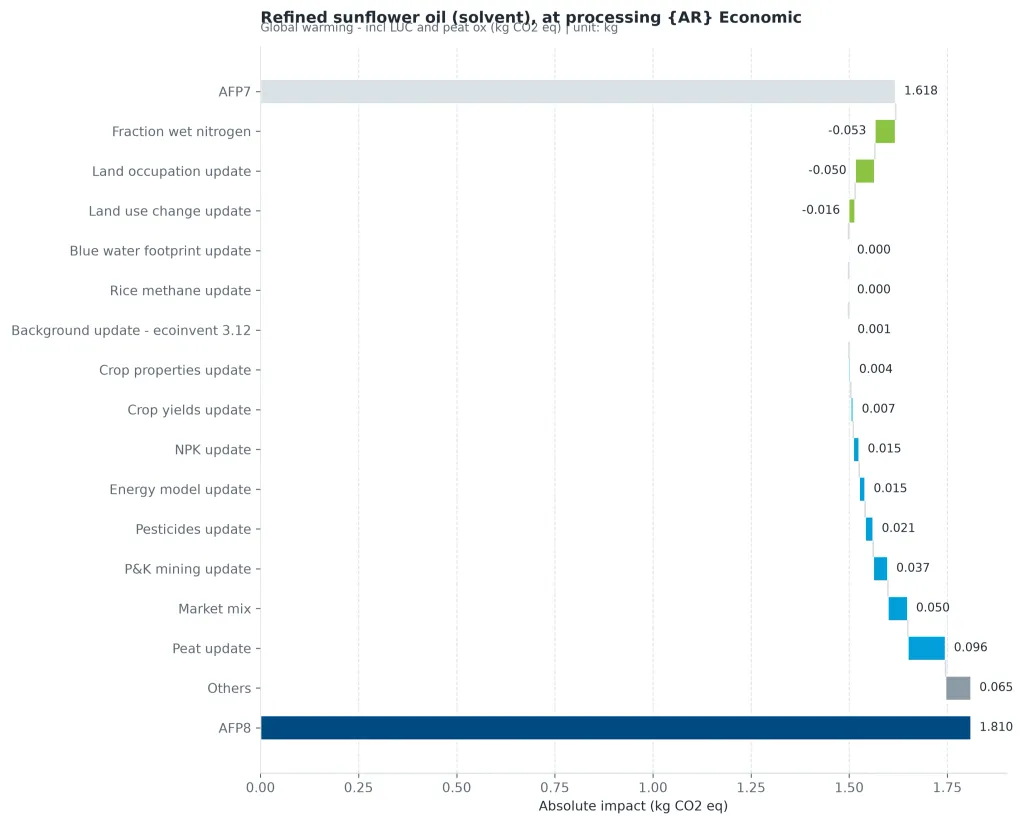
Figure 3 – What drives the change? Contribution of each update to the climate impact of refined sunflower oil from Argentina (incl. LUC and peat, kg CO₂-eq/kg), from Agri-footprint 7 (top bar) to Agri-footprint 8 (bottom bar).
Example 2: refined sunflower oil from Argentina
The increased footprint for Argentine refined sunflower oil was primarily driven by updated peat modeling, which now applies a hierarchical data framework combining National Inventory Reports (NIR, 2022) with cropland maps from Cao et al. (2026) for a more comprehensive account of drained peatland emissions.
On the other hand, the primary driver for emission reductions was our updated country-specific wet climate factor (Frac). By better tailoring indirect N₂O modeling to local moisture regimes, this refinement substantially reduces calculated indirect N₂O emissions across drier agricultural regions such as Argentina.

What changed and why?' is the first question every client asks when updating their Scope 3 or product footprints. We can now show the exact drivers behind each change, down to the individual dataset
Credibility of Agri-footprint
Built on transparency and independent review
Agri-footprint version 8 represents our largest update since its initial release in 2013. While credibility is built over years with transparency and decades of pioneering experience, we also commissioned an external review.
To ensure methodological compliance, Agri-footprint 8 was critically reviewed by Agroscope, Switzerland’s federal centre of excellence for agricultural research. Applying ISO 14044 criteria adapted for a background database, Dr. Thomas Nemecek and his team conducted an in-depth audit of our data and methodology.
What further distinguishes Agri-footprint is our approach to change traceability. We believe that by isolating the updates, we can identify and explain the specific drivers behind changes in environmental impact results, providing users with transparency and confidence in the data.
Under the hood
Cross-cutting updates systematically applied
Borrowing a best practice from modern software development, Agri-footprint is built using change isolation. Instead of manually tweaking thousands of inventories or individual files, our system applies each methodological update systematically across the entire database, completely isolated from one another.
This guarantees methodological alignment across inventories while making it easy to inspect changes at a granular level. After every single update, we calculate the environmental impacts across the intermediate database.
By analyzing these intermediate versions step-by-step, we can pinpoint exactly how and why the footprint of a specific crop or product shifted from version 7 to version 8. Seamless, consistent, and transparent database updates are made possible by the architecture of the DGP.
By isolating every update and calculating database impacts step-by-step, we can explain the drivers behind result changes in Agri-footprint.